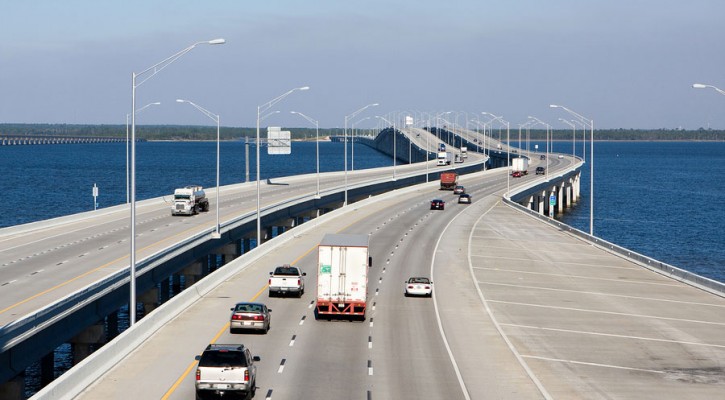
Florida Ranks Sixth Among Worst States For Drivers
March 17, 2014
In December of 2013, CarInsuranceComparison.com published a list of the Worst Drivers By State. Florida unfortunately, was listed as the sixth worst state for drivers in the country but to those who live and drive in the state, the news may not come as a complete surprise.
CarInsuranceComparison.com compiled this list by gathering data from various sources including; the National Highway Transportation Safety administration (NHTSA), Mothers Against Drunk Driving, (MADD), and the National Motorists Association (NMA). They scored each state according to five categories:
- Fatalities Rate per 100 Million Vehicle Miles Traveled
- Failure to Obey (Traffic Signals + Seat Belts)
- Drunk Driving
- Tickets
- Careless Driving
Each state, including the District of Columbia was given a ranking based on the data in each category. The higher the number, the worst the state scored. After each category was tallied, the state was given an overall score and ranked in comparison to other states. Florida’s score in each category was:
- Fatalities Rate per 100 Million Vehicle Miles Traveled – 33
- Failure to Obey (Traffic Signals + Seat Belts) – 38
- Drunk Driving – 18
- Tickets – 48
- Careless Driving – 51
That gave Florida an overall score of 188 placing the state in sixth place for the worst states for drivers. Florida received the first place rank in careless driving with a score of 51.
The top ten worst states for drivers along with their worst ranking are:
- Louisiana – Careless Driving # 48
- South Carolina – Careless Driving # 50
- Mississippi – Fatality Rate # 47
- Texas – Drunk Driving # 47
- Alabama – Tickets # 49
- Florida – Careless Driving # 51 (First place)
- Missouri – Failure to Obey # 48
- North Carolina – (Tied with Missouri) Careless Driving # 44
- Montana Fatality Rate and Drunk Driving # 51
- North Dakota – Drunk Driving #50
Which state was listed as the best? Vermont was ranked as the least most dangerous state for drivers with a top ranking category of 1 in careless driving.

Map A Car Crash
March 14, 2014
Curious about traffic crashes in your area? This website allows you to select and review details on every crash in the US between 1 January 2001 and 31 December 2009. See more: http://map.itoworld.com/road-casualties-usa

Drunk Driver Kills 2, Injures 23
March 13, 2014
A drunk driver trying to elude police in Austin TX plowed into a crowd at the popular SXSW Conference. He now faces two counts of capital murder and 23 counts of aggravated assault. http://kxan.com/2014/03/13/two-killed-multiple-injuries-after-car-runs-through-crowd-downtown/
Photo: KXAN TV, Austin Texas

Death Rate For Older Drivers Continues To Decline
March 11, 2014
In 2009, we wrote about studies showing that the death rate for older drivers (70 and older) were declining even as the older population was growing. The Insurance Institute for Highway Safety (IIHS) has come out with a new study that shows that trend is increasing.
Thanks to the baby boom of the late 40s and early 50s, the older population continues to grow but, according to the IIHS, older drivers are not only involved in fewer crashes, they are less likely to be killed or injured if they are involved in a crash.
While in the past, it was true that older drivers drove fewer miles than younger drivers, statistics show that, per vehicle miles driven, older drivers have actually increased their annual mileage rate compared to middle aged drivers (age 35-54). Continue Reading

What Causes Traffic Jams?
March 11, 2014
Ever wonder what causes traffic to back up when it seems like everyone should be moving right along? Autoblog has an interesting infographic that helps explain why traffic backs up and slows your morning and afternoon commutes. Continue Reading
